Table of Content
Introduction
NetFlow Overview
What is Netflow?
What is Caligare Flow Inspector?
Baseline Analysis
Top sessions
Top data streams
How to find out if I am being attacked?
Finding infected stations in your network
How to find out who attacked my network?
How to find out who attacked me?
Protection and Prevention
Summary
Introduction
There are a lot of ways to monitor and analyze your network traffic and protect it
from Internet intrusions. Organizations commonly use a firewall for network protection.
Although firewall logs often provide a huge information regarding intrusion attempts,
sometimes might be of too much data to sort through when there is a problem you
cannot resolve it quickly. Some organizations also use intrusion detection systems (IDS)
on border routers to analyze incoming traffic for patterns that indicate specific
problems. But firewall or intrusion detection system is used primarily on borders
with the Internet, rather than on internal networks. This is one of reason why
Cisco's NetFlow came to the rescue.
Netflow Overview
Netflow is a traffic monitoring and analyzing technology developed by Darren Kerr
and Barry Bruins at Cisco Systems. Netflow describes the method for a router
and/or intelligent switch to export statistics about the dataflow, and this
built-in feature is found on most Cisco routers
as well as Juniper,
Extreme Networks,
Riverstone etc. NetFlow technology
provides the data necessary to effectively analyze trend and baseline application
data as it passes through the network. It can then be exported to a reporting
package and can provide the information necessary to manage critical business
applications.
What is Netflow?
Netflow is defined as a
unidirectional sequence of packets between a given source
and destination which means there will be two flows for each connection session,
one from the server to client, one from the client to server. In order to
distinguish flows from one another, the source and destination addresses,
protocol and port numbers are used. The Type of Service and source input
interface index are also used to uniquely identify the flow to which a packet
belongs. A flow is determined to have ended when it has been idle for a specified
length of time, when it has become older than a specified age (30 minutes by
default) or when the flow is a TCP connection a FIN or RST has been sent. The
router may expire flows more aggressively if it is running out of cache space.
A number of router vendors have implemented their version of netflow, but version
5 is now the most common. For a NDE version 5, every single UDP packet contains
one flow header and thirty flow records at maximum. Every flow record is made up
of several base fields and the rest which include: next hop address, output
interface number, number of packets in the flow, total bytes in the flow, source
and destination AS number, source and destination network length and TCP flags
(cumulative OR of TCP flags).
What is Caligare Flow Inspector?
Caligare Flow Inspector
is a unique network software solution for companies,
who need to plan, build, maintain and manage their network and at the same time
keep their network more secure and efficient. Caligare Flow Inspector is a
web-based bandwidth monitoring tool that uses NetFlow data export to provide
detailed traffic statistics that help answer who, what, when, where of bandwidth
usage.
CFI software was engineered to create a secure network-monitoring platform
based on industry standards that will fit your existing security policies.
The results are the ability to monitor in real time, significantly reducing
the time it takes to identify problem and troubleshoot. CFI keeps track of
what is happening in your corporate network, detecting attacks, and warning
you of problematic network users. All information about network activities
are archived in a central database.
Baseline Analysis
A baseline analysis is a model describing what "normal" network activity is
according to some historical traffic pattern; any other traffic that falls
outside the scope of this traffic pattern will be flagged as malicious.
A trend analysis reports
is the most common and basic method of doing flow-based
analysis. In netflow analysis is main focus on records that have some "special
high traffic volume" attribute, especially the value of those flow fields that
deviate significantly from an established historical baseline. Normally there
are two ways to make use of baseline analysis methods: top sessions and top data.
Top sessions
A top sessions means a single host tries to open an abnormally high volume of
connections to a single node or block of nodes. The most reasons for these
activities are worms, denial of service attacks and network scans.
Common clients connecting to the Internet should keep a relatively normal connection
frequency. But if a host is infected with a worm, it will absolutely act different.
It will mostly open a huge number of connections to the destination for its attempts
to infect the next batch of victims.
For the same reason, when a lesser-skilled "script kiddies" is scanning a large block
of addresses for certain vulnerable services, we will see especially high volume
sessions sent out by that single IP address.
We can also use top sessions method to detect many kinds of network abuses, such as
checking the flow records for port 25 connection requests sent out by every single
host in real time. In a given duration, for any host, if the statistics of port 25
requests are above a 'normal' value, it could be considered to be a spammer or someone
infected with some kinds of email worm. It would be better for the Internet as a whole
if service providers started using this technology and shut down the spammers upon
detection.
Top data streams
A second method of using baseline analysis is top data. This can be defined as a large
amount of network data transferred in a certain period of time from a single host to a
single destination or block of destinations.
The Top hosts that transfer traffic data to or from the outside in an enterprise should
be ranked into relatively fixed groups. If this pattern changes, and a new host suddenly
appears in the Top hosts matrix, an alert should be triggered.
How to find out if I am being attacked?
Traffic inspection and analysis is a very complex problem. On the market there are many
tools as IDS, network traffic dump or network probes, but lack of them can process big
traffic volume (e.g. 10TB/hour). We decided to use netflow data export (NDE) that is
widely available on most high-end routers for user tracking and real time data flow
analysis. Netflow brings transparent view what is happening in your network. There are
several methods how to detect if "your" network is under attack.
- Packet size distribution. Many short packets (more than 60%) may signify suspicious traffic.
- Many connections from single host to considerable destinations.
- Using reserved or private IP address on the Internet.
- Excessive number of ICMP messages.
In the latest version of Caligare Flow Inspector software there is implemented packet
distribution statistic. In our company we are using small honey pot network (without any
real stations) for attack analyzing. Example of attack you can see on the picture 1. On
the picture there is almost 100% small packets (more that 70% small packets is typical
for network attack in most cases). You can use the following steps to locate the source
of the problem and some tips on how to filter suspicious traffic.
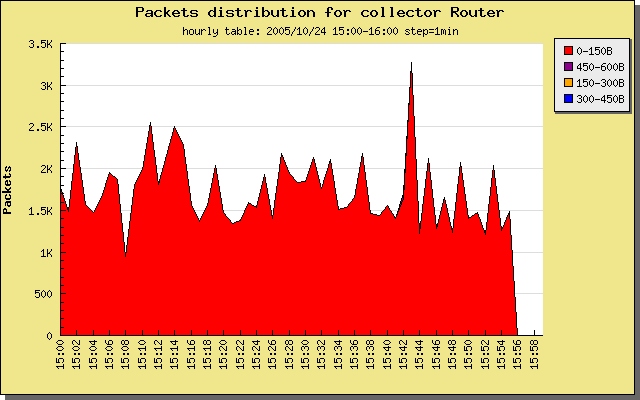
Picture 1: Packet size distribution.
Finding infected stations in your network
NetFlow Inspector software is the ideal tool for detecting worm sources (infected stations)
in your network. Trends menu may be used for this type of analysis. The following example
gives you information on how to find infected stations in your local network.
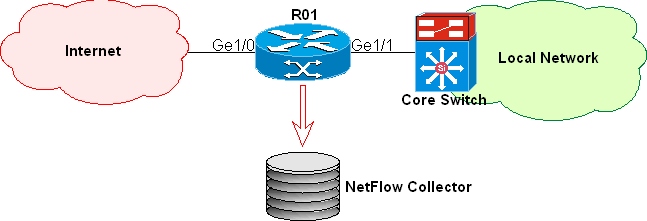
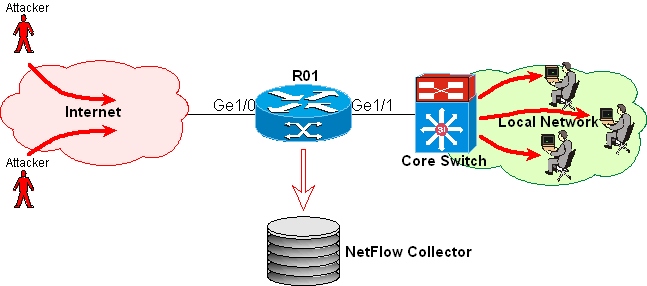
Picture 2: Classic network hierarchy.
Log into Caligare Flow Inspector and run the following steps:
- Select collector that stores netflow data exports (in our case: router R01).
- In the table selector choose current hourly table.
- Select statistic: source host distributions.
- Set source interface (Gigabit Ethernet 1/1).
- Set destination interface (not Gigabit Ethernet 1/1).
- Run search query.
After displaying source host distributions you can view top ten source IP addresses
sorted by number of used unique destination IP addresses (see picture 3). These source
IP addresses are candidates on the infected stations.
Check result and select possible infected stations (infected station pool more than
500 unique destinations in most cases). Ignore your servers that are normally heavy
used. Web or application servers normally generate many connections to many destinations.
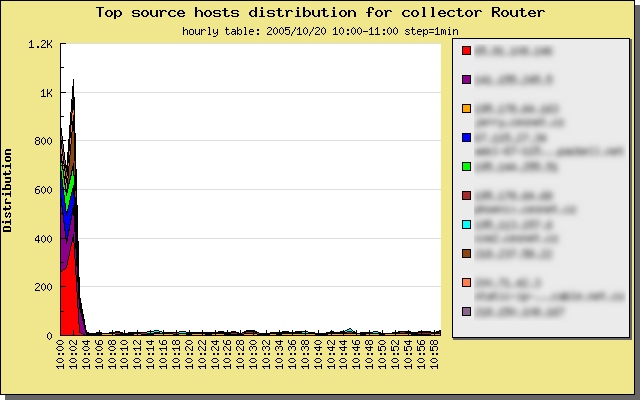
Picture 3: Top source host distribution (IP addresses are hidden).
Write top 5 sources to notebook and then continue to infected station confirmation step.
For each candidate IP address run the following query:
- Set statistic: destination ports by packet.
- Source IP address: <test_IP_address_from_notebook>
- Run search query.
Check destination ports that are in use by potentially infected station. In most case
(when station is infected) you will see some of following ports: netbios (137, 138, 139),
microsoft-ds (445), ms-sql-s (1433), www (80, 3128) etc (see picture 4).
Now, is a good time to consider if your candidate is infected or not. Decision is
yours, because only you know "your" network and servers. If a station opens more
than 500 unique destination connections to port 1433, this seems like very
suspicious activity.
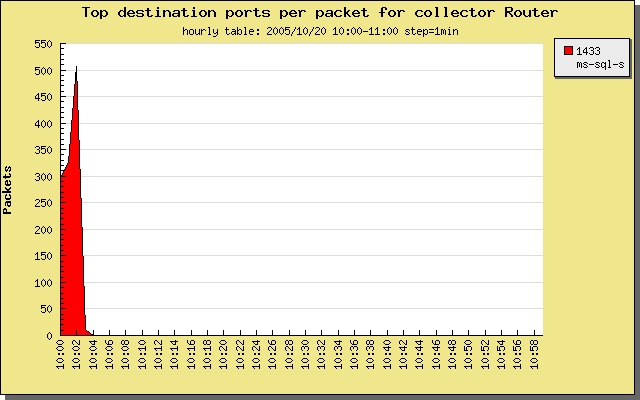
Picture 4: Top destination ports by packet.
How to find out who attacked my network?
Picture 5 shows a typical network attack. The infected station tries to open a
connection to all the servers in your network. You can simply locate this attack
by finding the source host that is trying to open a connection to various
destinations in your local network.
Picture 5: Typical worm attack by infected stations on your local network.
Check caption "Finding worm sources in your network" and how to find these source
hosts. Sophisticated worm sources do NOT pool your whole network, but instead
randomly or pseudo-randomly try to open from time to time a single host connection.
Locating these attackers is difficult but NOT impossible! You can use TCP flags and
ICMP tracking. When the attacker tries to open the TCP connection to an unused
destination IP address the TCP SYN flag is set. If the connection is successful
you will see cumulative TCP flags SYN and ACK, if the connection is unsuccessful
you will see only flows with SYN flag. You can count the unsuccessful connections
for every source IP address outside your network and source, the one with the most
of connections found is your attacker candidate. If attacker is using UDP protocol
and pools your whole network, an excessive number of ICMP messages will then be
generated.
How to find out who attacked me?
If you suspect (or know) that your station is victim to an attack, then you probably
want to know who is the attacker. Locating the attacker is simple if source IP address
is NOT spoofed. Select "Trends" menu and use "Source host by packet" statistic. Type in
your IP address (victim) into destination host field and run search query. Result is a
list of source hosts who communicated with you sorted by number of packets. Often the
first host located is the attacker. In case source IP address is spoofed (often used
reserved or private IP address) you can only locate source interface through that
malicious traffic going into your station. You can not filter this attacker if he uses
random source IP address, you can only contact provider or your ISP peer operator.
Protection and Prevention
You can use many protection mechanisms, these are widely available through access
lists on Cisco routers.
- Create new access list: ip access-list extended <list_name>
- Add block rule: deny ip <wild mask> any
- Repeat step 2 for each attacker
- Permit any other traffic
- Check access list rules: show ip access-list <list_name>
- Apply access list on source interface: ip access-group <list_name> in
Example:
configure terminal
ip access-list extended block_attacker
 deny   ip 10.0.0.0 0.255.255.255 any
 deny   ip 192.168.0.0 0.0.255.255 any
 deny   ip 80.95.102.33 0.0.0.0 any
 permit ip any any
 permit pim any any
 permit igmp any any
 exit
interface GigabitEthernet 1/1
 ip access-group block_attacker in
 exit
Be very careful before updating access list! On many routers the default rule is drop
any traffic if access list exists. We recommend removing access list from interface then
creating a new access list and reassign it to interface. On picture 3 is the result of
applying access list on our router R01 that was applied at 10:03.
Summary
This attack detection manual has discussed the flow-based analysis of malicious traffic
and abnormal activities. With top sessions and top data methods, network administrators
can simply detect network anomalies in real time more effectively. There is no universal
process on how to find source of attack, but with Caligare Flow Inspector software we may
make your corporate network run better.
Contact: caligare@caligare.com
Copyright: Caligare Company
Last-Modified: November 4th 2005
|

